In a region with nine cities and hundreds of neighborhoods, choosing the community that feels right for you is no small decision. That’s where this report comes in. We’ve broken down real estate activity and resident demographics across the desert to offer a clearer view of what’s happening now — and where the market in Greater Palm Springs may be headed next.
HOW TO NAVIGATE THIS SECTION
As you scroll the page, you’ll find a snapshot of housing trends across the Coachella Valley. Use the sidebar or the images below to explore real estate data. Select a city name to view overall trends, or the plus sign to see neighborhood-level insights.
Data appears in both map and chart formats:
- Maps: Select any neighborhood to open a pop-up with detailed data.
- Charts: Select the column headers to sort by different data points.
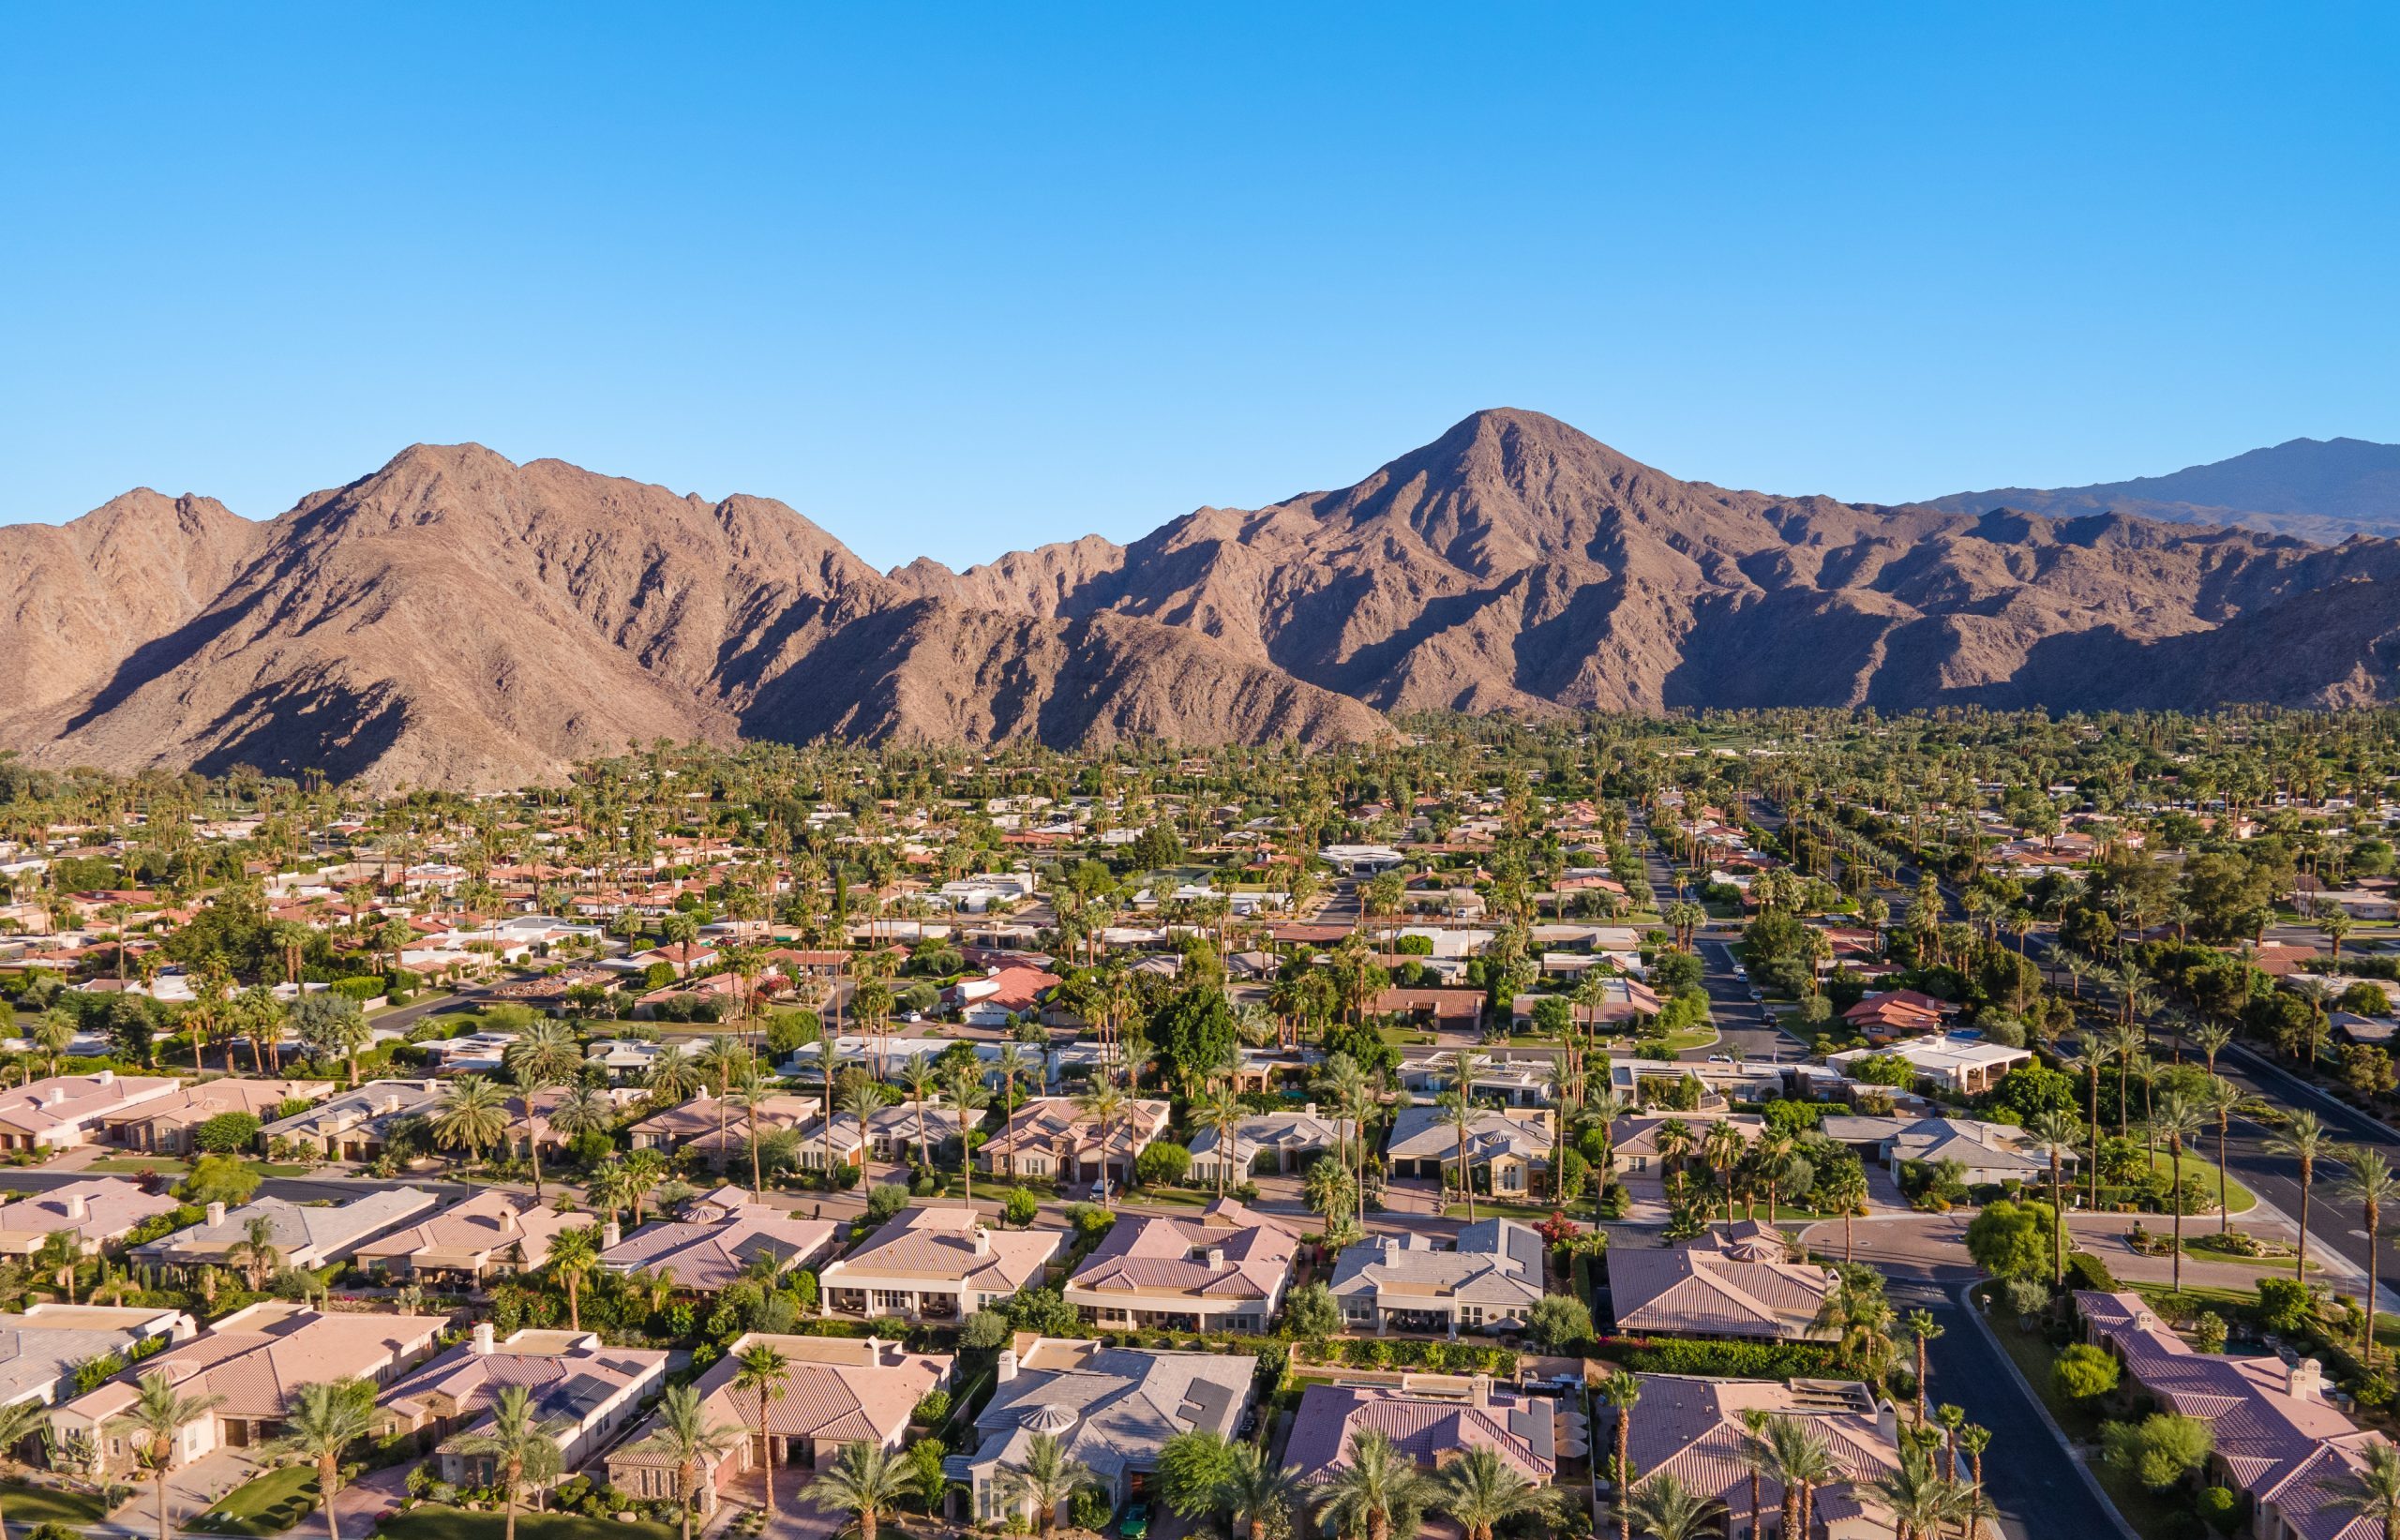
Find the Right Neighborhood for You

HOW WE GOT THE NUMBERS
The information in this section was compiled with help from geographic information systems specialist David Robinson and Michael McDonald and Vic Cooper of Market Watch LLC, a nationally recognized real estate advisory firm that publishes the Desert Housing Report for the Greater Palm Springs Board of Realtors (GPSR) and a subdivision analysis presented by Franklin Loan Center.
Demographic data comes from Esri’s GIS software and specifically their Business Analyst data subscription service, using estimates based on the 2020 U.S. Census to forecast current conditions. These estimates are calculated by mapping Census blocks to subdivision boundaries — yielding the best possible snapshot of each neighborhood but is not an official count from the communities themselves.
Real estate data comes from Market Watch calculations using the desert MLS database mutually owned by CDAR and GPSR. To determine the price of an average-size home in each subdivision, they start by calculating the typical home size based on sales over the past 10 years. Then, they apply the current average price per square foot from recent sales to that size. This method helps show how prices are changing over time — without being skewed by whether larger or smaller homes happened to sell that month.
All figures are estimates and should be viewed as a general guide to local real estate trends.
Please note: Not every neighborhood is included. This section features a representative sampling of subdivisions and country clubs to illustrate the broader market trends throughout Greater Palm Springs.
This section was made possible with support from PGA WEST in La Quinta.
For more information about PGA WEST, click here.
| City | Price of Average Size Home | 1-Year Price Change in Average Size Home | Average Household Income | Median Age |
|---|---|---|---|---|
| Palm Springs | $1,261,065 | -4.2% | $121,312 | 58.7 |
| Desert Hot Springs | $402,240 | 4.5% | $67,309 | 34.7 |
| Cathedral City | $587,961 | 4.3% | $93,430 | 42.9 |
| Rancho Mirage | $1,343,660 | -4.0% | $167,996 | 67.4 |
| Palm Desert | $760,122 | 1.6% | $125,131 | 57.3 |
| Indian Wells | $2,273,378 | 18.6% | $197,209 | 68.4 |
| La Quinta | $920,557 | 7.9% | $149,029 | 52.8 |
| Indio | $655,094 | 2.3% | $97,782 | 38.6 |
| Coachella | $443,420 | 1.9% | $69,792 | 30.1 |